Advertisement

Mastek Ltd Bombay stock exchange technical chart updated on 23rd June 2015, Tuesday.


MASTEK LTD


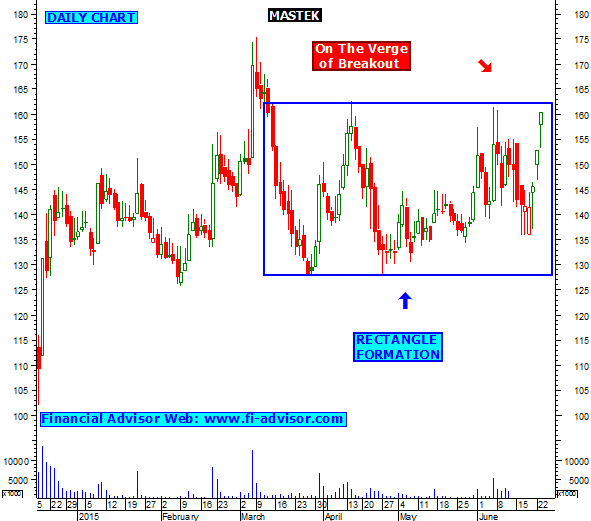
Mastek limited Bombay stock exchange technical chart indicates that stock has formed rectangle pattern in daily chart, trend will be mix as long as it trades in between.
Sharp movement is expecting once stock comes out from its pattern. Close watch stock is trying to break it on upper side.

Kalpataru power national stock exchange chart updated on 23rd June 2015, Tuesday.


KALPATARU POWER


Stock has given a bullish breakout signal as it had formed head and shoulder pattern in daily chart. Its previous resistance is now acting as a major support as long as it holds above bulls will be favored and further price rise can be seen in coming days.

Suggested article to read - All you want to know about National stock exchange.

Jain Irrigation NSE chart updated on 23rd June 2015, Tuesday.


JAIN IRRIGATION


Jain irrigation NSE chart indicates that it has formed head and shoulder in daily chart and is now finding trend line resistance, bulls action can be seen in this stock once it closes and holds above its trend line resistance.
Click here to see list of NSE holidays 2015.

Indo tech transformers stock analysis done on 23rd June 2015, Tuesday.


INDO TECH TRANSFORMERS


Indo tech transformers has formed double bottom pattern in daily chart bull will be favored once it closes and holds above its trend line resistance.

Visit link below to read article on Fundamental analysis of stocks :-

Indiabulls real estate candlestick patterns updated on 23rd June 2015, Tuesday.


INDIABULLS REAL ESTATE


India bulls real estate candlestick pattern indicates that stock has formed long bullish pattern this indicates bulls will be favored once stock holds above 56.50. This long bull candle comes with a good trading volumes this shows bulls are currently active in this stock.
Visit link below to read article on Japanese candlestick patterns :-

IGARSHI Motors intraday trading methods stock chart updated on 23rd June 2015, Tuesday.


IGARSHI MOTORS


Igarshi motors chart indicates that stock is moving up from strong trend line support zone as long as it holds above bulls will be favored. Current bull move comes with a strong volume this will favor bulls.
On upper side once stock closes and holds above its previous top then further bulls action can be seen in coming days.
Intraday action can be seen once stock holds above its previous top during market hours.
Visit link below for article on trading methods : -

Hitachi homes intraday trading strategies technical chart updated on 23rd June 2015, Tuesday.


HITACHI HOMES & LIFE SOLUTIONS (I)


Hitachi homes intraday trading strategies technical chart indicates that stock has formed ascending triangle pattern this is usually a bullish pattern. Once stock closes and holds above its pattern then bulls will be favored.
Intraday we can see some bulls action once stock starts trading above its pattern. Close watch.

GM breweries share market chart updated on 23rd June 2015, Tuesday.


GM BREWERIES


GM breweries stock moving up from 200 DMA this will favor bulls as 200 DMA plays very important role in technical analysis. On upper side stock is finding strong 50% fibonacci retracement resistance once stock closes and holds above then further bulls action can be seen and stock will find next strong resistance at its golden ratio.
Click below to read article on How share market works :-

Garware wall ropes stock market chart updated on 23rd June 2015, Tuesday.


GARWARE WALL ROPES


Garware wall rope stock indicates that it is finding strong trend line resistance at current levels once stock closes and holds above then further strength can be seen in coming days.
Intraday bulls action can be seen once stock closes and holds above its trend line resistance.
Suggested article to read - How stock market works.

Fortis health care financial market trading tips updated on 23rd June 2015, Tuesday.


FORTIS HEALTHCARE


Fortis heathcare financial market trading chart indicate that it has formed triangle pattern in daily chart as long as it will move in between its pattern trend will be mix with no clear direction.
Sharp movement can be seen once stock comes out from its triangle pattern in daily chart.
Suggest article - Click here to read What is Financial markets.


Financial technical technical chart updated on 23rd June 2015, Tuesday.


FINANCIAL TECHNOLOGIES


Financial technologies stock market technical chart indicates its is finding strong resistance at current levels that is golden ratio and strong trend line resistance as long as it holds below bear will be favored.
Stock will favor bulls once it closes and holds above its resistance zone.
Suggested article - What is financial market.

Indiabulls housing finance stock tips chart updated on 23rd June 2015, Tuesday.


Indiabulls housing finance stock tips weekly chart indicates that it is moving up from 23.6% fibonacci retracement so long as it holds above short term trend will be favored by bulls.
Once it closes and holds below 23.6% retracement support then weakness can be seen.
On upper side further strength can be seen once it closes and holds above its previous top.
Click here to read more stock tips.

HDFC LTD stock tips technical chart updated on 23rd June 2015, Tuesday.


HDFC Ltd stock tips technical chart indicates that stock has formed double bottom pattern in daily chart, this indicates sharp movement can be seen once stock comes out from its pattern.
On upper will find trend line resistance once HDFC Ltd closes and holds above its trend line resistance then bulls can show some action. Close watch.

Ambuja cements free intraday tips updated on 23rd June 2015, Tuesday.


AMBUJA CEMENTS


Ambuja cements free intraday tips chart indicates that it is moving up from strong trend line support zone and it is now finding strong trend line resistance at current levels.
Once it closes and holds above then further bulls action can be seen in Ambuja cements.
Its trend indicators are now turned positive this will favor bulls.

Advertisement

What is Intraday Tips ?

Q. What is Intraday Tips / Inraday Trading / Delivery trading.

A. There are basically two types of trading on stock market--
1- Delivery
2- Intraday

Delivery trading is one in which shares are bought and can only be sold after they are delivered by the broker.that means that they cannot be sold the same day , and delivery takes two to three days after they are bought and then they are ready to be sold.

Intraday trading which takes place for that very particular day and there is no delivery..they can be bought and sold the same day...and are automatically sold at the end of the trading session if you have not sold it by yourself during the trading session. The person who suggest such types of forecast is called

Intraday Tips

.