Advertisement

THOMAS COOK Share Tips, Technical Analysis Chart, Intraday Stock Trading Graph Advice - Stock moving in a up channel formation, further strength expecting once stock closes above its resistance @ 162. (Updated on 22nd September 2014, Monday).


THOMAS COOK


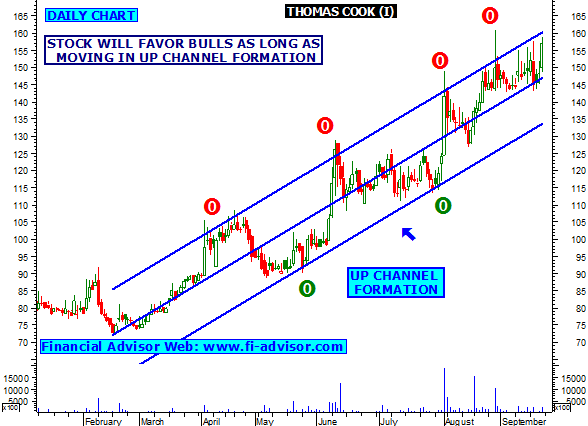
  • Stock moving in up channel formation, bulls will be favored as long as trades in between. (shown in chart no1).
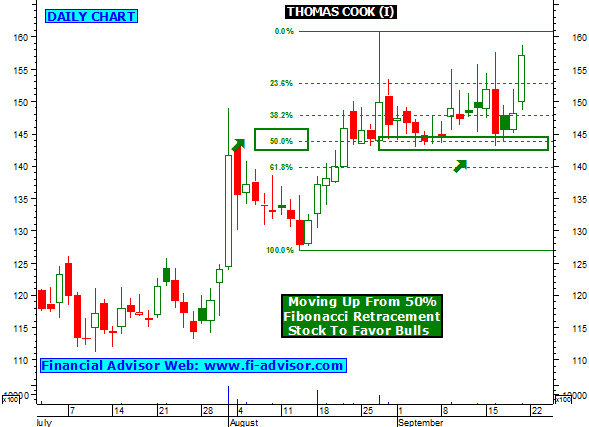
  • Thomas cook also moving up from 50% fibonacci retracement support, will favor bulls as long as trades above. On upper side stock will find resistance @ 162 its previous top, once closes and stays above 162 then looks bulls for next few trading days.
    • Intraday close watch once stock  starts trading above 162 during trading hours, If holds above 162 then intraday bulls action is expecting.
  • As per stock analysis chart no3, if Thomas cook moves up from current levels, then will find resistance around 171 its 161.8% fibonacci retracement.

IDEA CELLULAR Share Tips, Technical Analysis Chart, Intraday Stock Trading Graph Advice -Stock moving up from 50 DMA, will favor bulls, further strength expecting once IDEA closes above 177.50. (Updated on 22nd September 2014, Monday).


IDEA CELLULAR


  • As per chart no1, IDEA Cellular is moving in a up channel pattern, this is a bullish pattern and as long as stock trades in between bulls will be favored.
  • Chart also indicates that stock is moving up from 50 DMA and is now finding resistance around 177.50, once closes and stays above 177.50 then bullish action can be seen for next few trading days.
    • Free Intraday tips - Close watch once Idea starts trading above 177.50 during trading hours then intraday action is expecting.
  • According to weekly chart , Doji has appeared this usually indicates change of trend and sharp movement. Close watch if breaks resistance then sharp movement can be seen.
  • If stock moves up from current levels then will find next resistance around 185, levels as per fibonacci retracement. Close Watch.

BOB Share Tips, Technical Analysis Chart, Intraday Stock Trading Graph Advice - Stock trading above its golden ratio, bulls will be favored as long as trades above, further strength expecting once BOB closes above 966. (Updated on 22nd September 2014, Monday).


BANK OF BARODA


  • As per chart no1, stock is moving above its golden ratio resistance, this indicates as long as stock trades above bulls will be favored.
  • As per technical chart no2, BOB is trading above its 20 DMA, this too will favor bulls as long as stock holds above. Even stock major trend indicator "MACD" is in +ve zone and above levels zero, this indicates further price rise can be seen.
  • As per chart no3, Once stock closes and starts trading above 966 that`s its recent high then further strength is expecting and on upper side will find next resistance around 1009.
    • Intraday trading tips - Close watch once stock starts trading above 1009 during trading hours, if holds above 1009 then intraday bulls action is expecting.

PETRONET LNG Share Tips, Technical Analysis Chart, Intraday Stock Trading Graph Advice - Stock moving in a up channel patter and stuck in a range, will favor bulls once again once stock closes above 207.50. (Updated on 22nd September 2014, Monday).


PETRONET LNG


  • According to current Technical analysis chart no1, Petronet LNG is moving in a up channel formation, as long moves in between its pattern bulls will be favored.
  • As per chart no2, stock is also stuck in a range bound zone 207.50-189, as long as stock moving in its range trend will not be clear, once it comes out then sharp movement is expecting.
  • As per stock analysis chart no3, stock is also facing 161.8% fibonacci retracement resistance around 207.50, once stock closes and stays above 207.50 then  bulls will favored for next few trading days and on upper side will find next resistance around 227 its 261.8% fibonacci retracement.
    • Intraday stock tips - Close watch once Petronet starts trading above 207.50 during market hours , if holds above 207.50 then intraday bulls action is expecting.

Advertisement

What is Intraday Tips ?

Q. What is Intraday Tips / Inraday Trading / Delivery trading.

A. There are basically two types of trading on stock market--
1- Delivery
2- Intraday

Delivery trading is one in which shares are bought and can only be sold after they are delivered by the broker.that means that they cannot be sold the same day , and delivery takes two to three days after they are bought and then they are ready to be sold.

Intraday trading which takes place for that very particular day and there is no delivery..they can be bought and sold the same day...and are automatically sold at the end of the trading session if you have not sold it by yourself during the trading session. The person who suggest such types of forecast is called

Intraday Tips

.