Advertisement

SBIN Share Tips, Technical Analysis Chart, Intraday Stock Trading Graph Advice - Stock moving up from strong support, close watch further strength expecting once SBIN closes above 2645. (Updated on 19th September 2014, Friday).


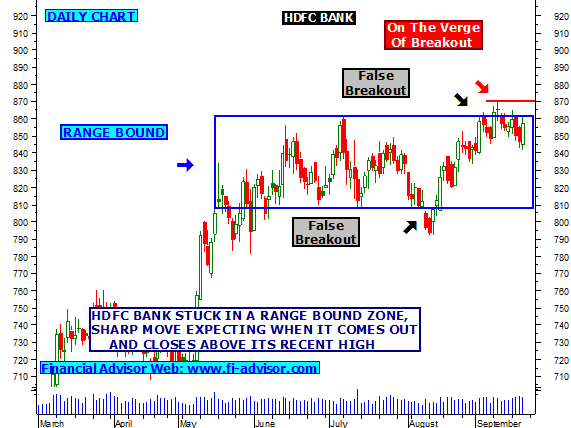
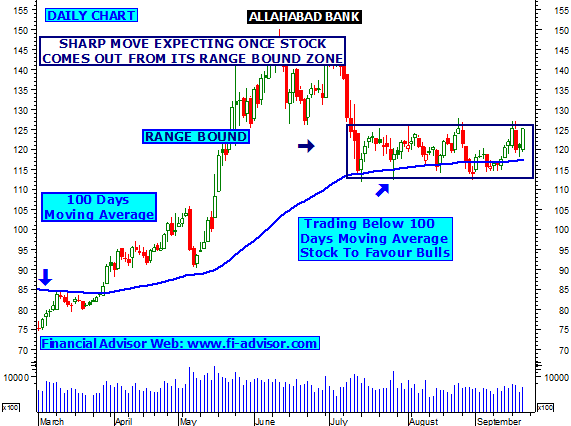
STATE BANK OF INDIA (SBIN)


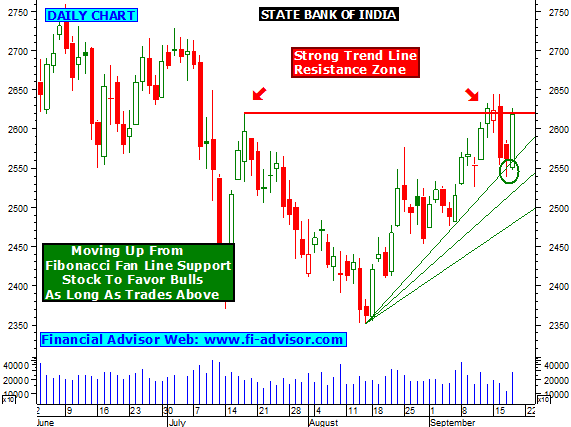
  • SBIN currently moving up from fibonacci fan line support, this indicates as long as stock holds above 2537 bulls will be favored. On upper side SBIN will find trend line resistance around 2645. Once stock closes and holds above 2645 then bulls will be favored and price up movement can be seen.
    • Intraday close watch once SBIN starts trading above 2645, if holds above then intraday bulls action is expecting.
  • Stock also moving up from 100 DMA, as long as holds above bulls will be favored, closing below 100 DMA indicates first sign of weakness.
  • If stock moves up and closes above 2645 then will next strong resistance around 2730, 2760 and 2834. Close Watch.
  • Visit link for Daily nifty futures technical analysis.

HDFC BANK Share Tips, Technical Analysis Chart, Intraday Stock Trading Graph Advice - Stock moving in a range bound zone, close watch sharp movement can be seen once HDFC BANK closes above its recent high @ 870. (Updated on 19th September 2014, Friday).


HDFC BANK


  • HDFC BANK moving in a range bound zone, earlier stock had given some false breakout as show in chart no1, this time close watch if HDFC BANK closes and stays above 870 then stock to favor bulls for further strength.
    • Intraday close watch once stock starts trading above 870, if holds above 870 then intraday bulls action is expecting.
  • Chart no2 indicates that stock is moving up from fibonacci fan line support, this will favor bulls.
  • If stock moves up from current levels and closes above 870 then HDFC Bank will find next strong resistance around 903 its 161.8% fibonacci retracement as shown in graph no3.
  • Day trading stock tips.

CESC LTD Share Tips, Technical Analysis Chart, Intraday Stock Trading Graph Advice - Stock fell down after breaking its major resistance, Will favor bulls cone CESC closes above its recent high @ 828.(Updated on 19th September 2014, Friday).


CESC LTD


  • Stock gave a sharp up move after breaking its major resistance @ 785, CESC closes above its resistance but failed to sustains above and stock fell down after that, Close watch now technical chart indicates if CESC closes and stays above its recent high @ 828 then bulls will be favored for next few trading days.
    • Intraday closes watch above 828, if holds above 828 during trading hours then intraday bulls action is expecting.
  • Even stock major trend indicators "MACD" and "Stochastic Oscillator" is moving in a +ve zone, and RSI is below level 70 and stock is also moving above 20 DMA, all this indicates that bulls will be favored and further price rise can be seen as long as they stand +ve.
  • If stock moves up from current levels and closes above 828 then will find next strong resistance around 898, as shown in chart no3.
  • Click here for Nifty futures trading levels.

BF UTILITIES Share Tips, Technical Analysis Chart, Intraday Stock Trading Graph Advice - Stock moving up from strong trend line and 200 days moving average, further strength expecting once BF UTILITIES closes above 690. (Updated on 19th September 2014, Friday).


BF UTILITIES


  • According to technical analysis chart no1, BF UTILITIES moving up from strong trend line support @ 584, as long as holds above bulls will be favored, on upper side stock will be finding resistance around 690, once closes and stays above then further strength is expecting. From past few days stock showing some good volumes with increasing price , indicates bulls are taking interest in BF Utilities. Close Watch.
    • Intraday close watch once stock starts trading above 690, if holds above then intraday bulls action is expecting.
  • As per chart analysis no2, stock is moving up from 200 DMA, as long as holds above bulls will be favored, once closes below then stock will indicate the sign of weakness.
  • As per chart no3, if stock moves up from current levels and closes above 690 then will find next strong resistance around  700 and 728, levels as per fibonacci retracement.
  • Click here for free Nifty technical analysis.

ALLAHABAD BANK Share Tips, Technical Analysis Chart, Intraday Stock Trading Graph Advice - Stock moving up from support and stuck in a range bound zone, close watch bulls will be favored once Allahabad Bank closes above 128. (Updated on 19th September 2014, Friday).


ALLAHABAD BANK


  • Stock moving up from golden ratio support, will favor bulls once closes and stays above 128, Intraday bull action can be see once Allahabad Bank holds above 128 during trading hours.
  • Stock moving in a range, and also above 100 DMA, once breaks its range of upper side @ 128 and holds above then some action is expecting.
  • Stock major indicator "MACD" and "Stochastic Oscillator" is moving in +ve zone, some further price improvement can be seen as per trend indicators.
  • As per monthly chart, Allahabad bank moving in a down channel formation, once closes and stays above 150 then stock to favor short-long term traders.
  • Free stock market tips.

Advertisement

What is Intraday Tips ?

Q. What is Intraday Tips / Inraday Trading / Delivery trading.

A. There are basically two types of trading on stock market--
1- Delivery
2- Intraday

Delivery trading is one in which shares are bought and can only be sold after they are delivered by the broker.that means that they cannot be sold the same day , and delivery takes two to three days after they are bought and then they are ready to be sold.

Intraday trading which takes place for that very particular day and there is no delivery..they can be bought and sold the same day...and are automatically sold at the end of the trading session if you have not sold it by yourself during the trading session. The person who suggest such types of forecast is called

Intraday Tips

.