BATA INDIA LTD
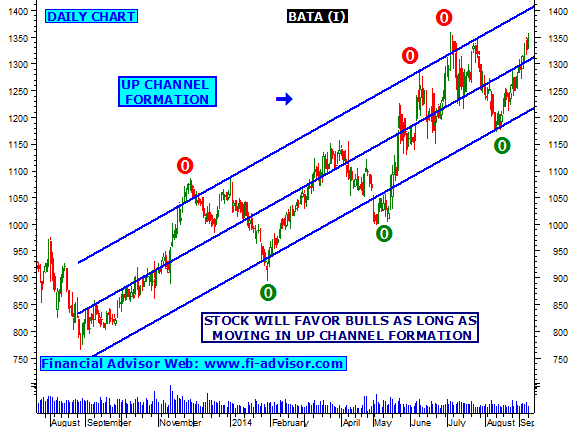

- As per current stock analysis chart no1, BATA is moving in a up channel formation , as long as stock moving in channel formation it will be favored bu bulls, but once Bata breaks its up pattern on down side then weakness is expecting.
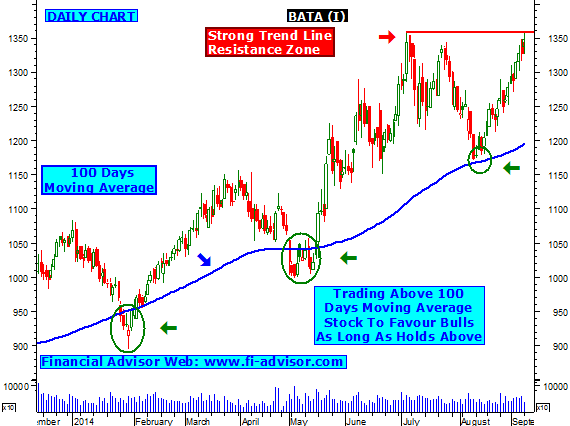
- As per graph no2, 100 days moving average is playing an important role from last 3 time we have witnessed big bull rally as soon as stock touched 100 DMA, on upper side stock is finding strong trend line resistance around 1360, once stock closes above 1360 and stays above then stock looking bullish for next few trading days.
- Free intraday stock tips - close watch once stock starts trading above 1360, if holds above 1360 with volumes then intraday bulls action is expecting.
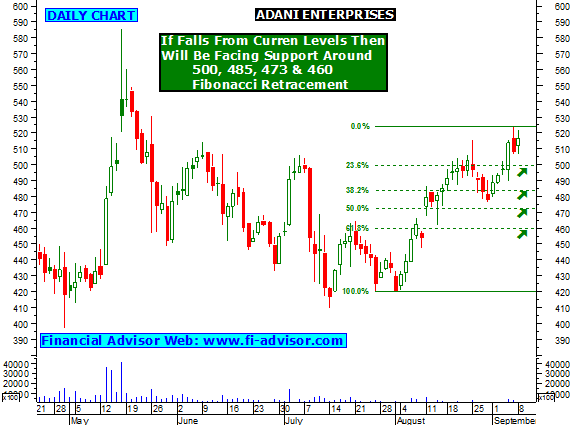
- Suggested Reading - ADANI ENTERPRISES facing strong trend line resistance at current levels, will favor bulls once closes above, till then stock can correct.
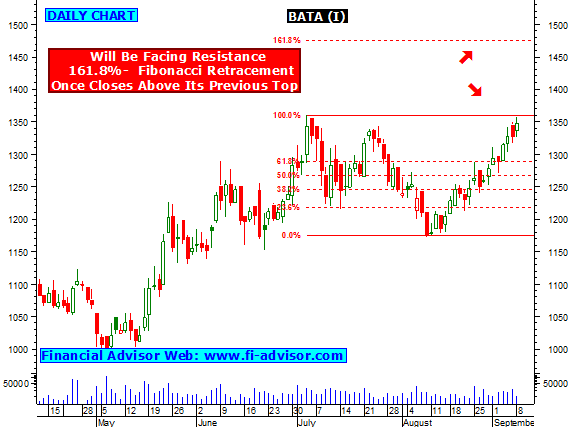
- As per graph no3, if stock moves up from current levels and closes above 1360 then Bata will find next resistance around 1470 its 161.8% fibonacci retracement.
- Suggested Article - 5 Biggest Stock Market Myths.
- But if Bata falls from current levels then stock will find strong fibonacci retracement support around 1315, 1290, 1270 and 1250 as shown in chart no4.
- Click here to see all the free trading reports (tips) published by us on BATA INDIA.
- Equity trading tips.