UCAL FUEL SYSTEMS

- As per previous report published on UCAL FUEL, stock failed to close above its trend line resistance @ 83 and we witnessed selling after that and stock made a low around 68. (Click here to see previous report published on UCAL FUEL).
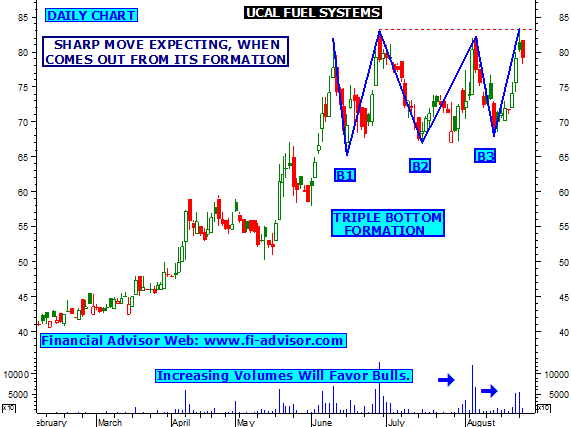
- Now current chart indicates that stock has formed triple bottom formation, this indicates once stock comes out from its formation then sharp move is expecting, currently UCAL is trading around its previous top, close watch once stock closes and stays above 83 then sock will be in bulls grip for next few trading days. As long as stock not breaking its formation trend will not be clear and stock will zig zag.
- Intraday tips , close watch once UCAL starts trading above 83, if holds above then intraday bulls action is expecting by UCAL.
- As per graph no2 stock 50 days moving average paying an important role, from last 3 times stock took 50 DMA support and bounced back, close watch as long as holds above it will favor bulls.
- Suggested Reading - TITAN moving in up channel formation, further strength expecting once closes above trend line resistance.
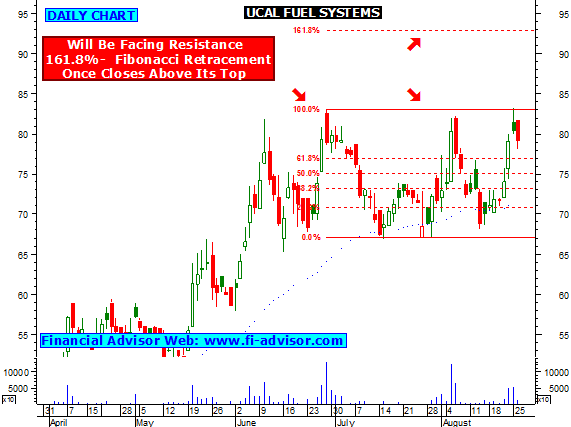
- As per graph no3 if stock closes and move up from 83 levels then UCAL will find next strong resistance around 92 its 161.8% fibonacci retracement.
- Click here to see all the free trading reports (tips) published by us on UCAL FUEL SYSTEMS.
- Intraday stock tips


