HCL TECHNOLOGIES

- As per previous report published on HCL TECH, stock gave sharp up move after breaking 1590 and made a high around 1630, but fell down after that.- (Click here to see previous report published in HCL TECHNOLOGIES).
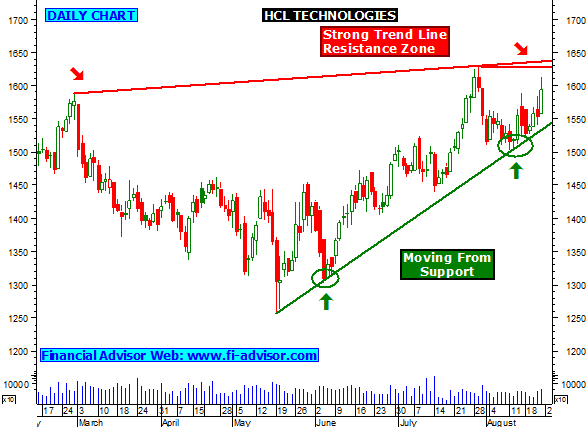
- Now daily chart indicates that stock is moving up from strong trend line support zone, this will favor bulls and stock will be facing strong resistance around 1630 as shown in chart no1, if stock closes and stays above 1630 then it will be favored by bulls for next 2-3 trading above.
- Intraday stock tips , close watch once stock starts trading above 1630, if holds above 1630 during market hours then intraday bulls action is expecting.
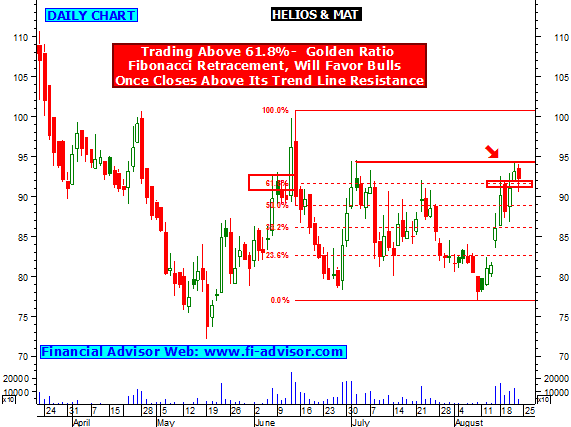
- Suggested Reading - HEXAWARE TECH facing strong golden ratio resistance, will favor bulls once closes above.
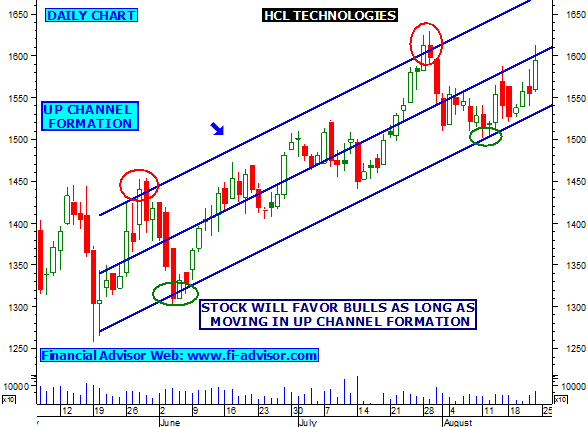
- As per chart no2 , stock is moving in a up channel formation, this indicates as long as stock moved in between its channel it will be favored by bulls. Weakness expecting once stock breaks down on down side.
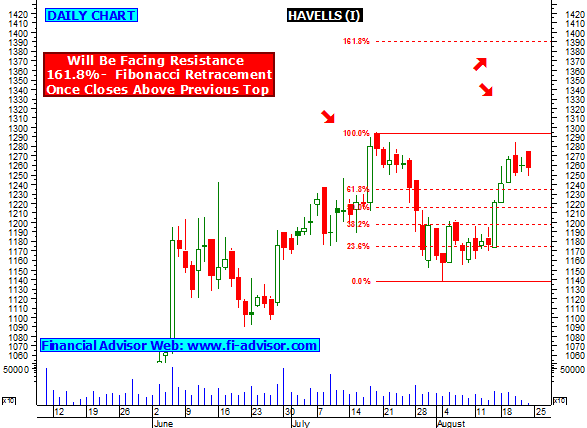
- If stock closes above 1630 and holds above then HCL Tech will find next strong resistance around 1705 as per 161.8% fibonacci retracement resistance as shown in chart no3.
- Click here to see all the free trading reports (tips) published by us on HCL TECHNOLOGIES.
- Free Indian stock tips for tomorrow.