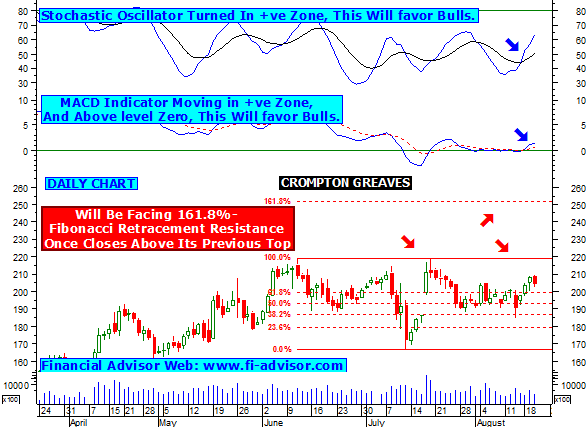
CROMPTON GREAVES
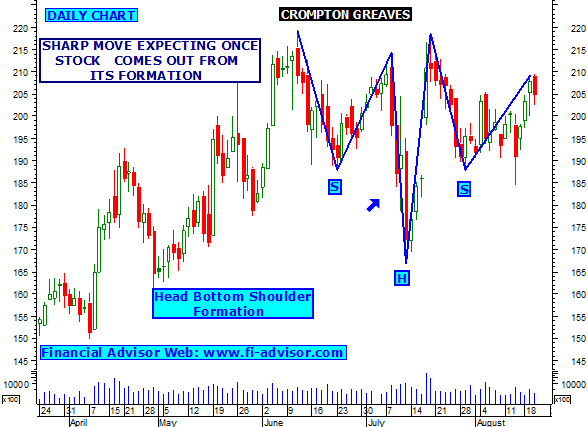
- Crompton has formed head and shoulder formation in daily chart, this indicates once stock comes out from its formation then sharp move is expecting, as per graph no1.
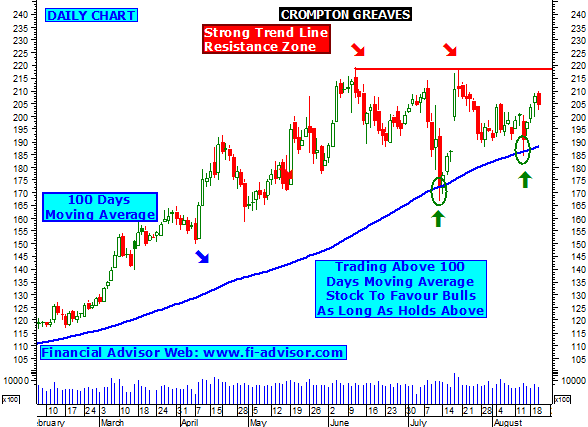
- Chart also indicates that stock is moving up from 100 days moving average support zone, this shows that Crompton will favor bulls as long as stock holds above, on upper side it will find trend line resistance around 218.50, Once stock closes and stays above 218.50 then it will favor bulls for next few trading days.
- Intraday close watch once stock starts trading above 218.50, if holds above in day trading then intraday bulls action is expecting.
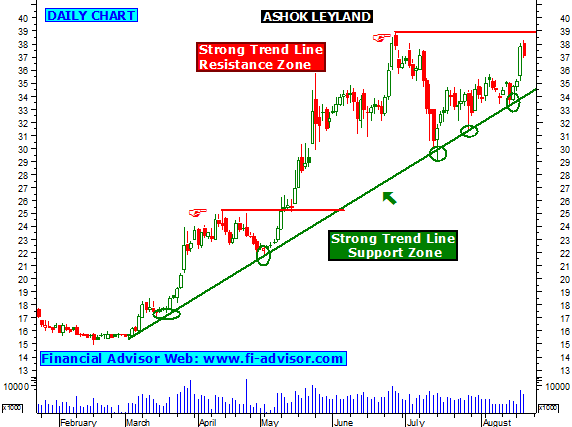
- Suggested Reading - ASHOK LEYLAND moving up from strong trend line support zone, will favor bulls if closes above resistance.
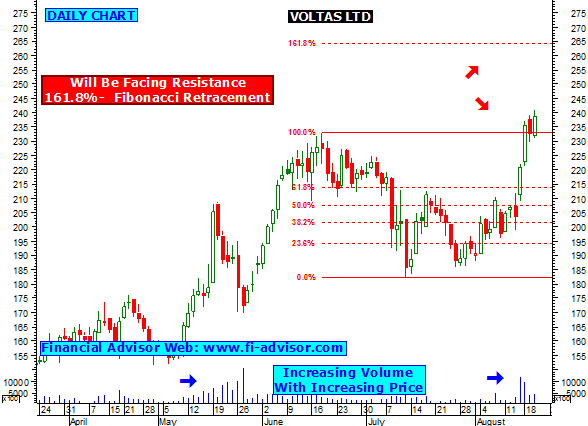
- As per graph no3 if stock moves up from current level and breaks its resistance @ 218.50 then will next strong resistance around 250 its 161.8% fibonacci retracement. Technical also indicates that stock major trend indicator "MACD" is moving in a +ve zone and also above level zero, this will favor bulls. And another trend indicator "Stochastic Oscillator" is also moving is +ve zone.
- Click here to see all the free trading reports (tips) published by us on CROMPTON GREAVES.
- Tips on shares.