Advertisement

JSW HOLDINGS Share Tips, Technical Analysis Chart, Intraday Stock Trading Graph Advice - Stock moving in range bound zone , sharp move expecting in JSW HOLDINGS once stock closes above 908, (Updated On 21st August 2014, Thursday).


JSW HOLDINGS


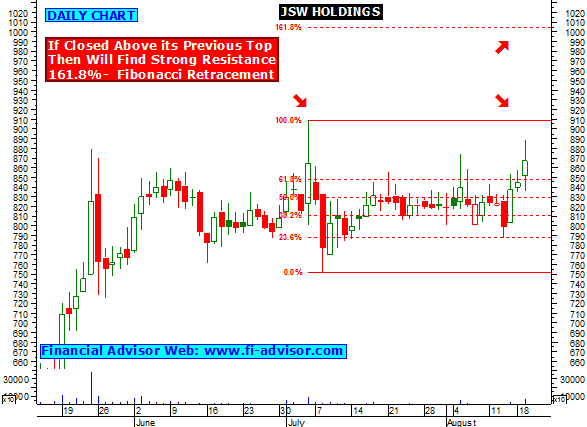
  • As per technical point of view JSW HOLDINGS in moving in a range bound zone, this indicates as long as stock moves in between its range trend will not clear, but once comes out from its range then sharp move is expecting.
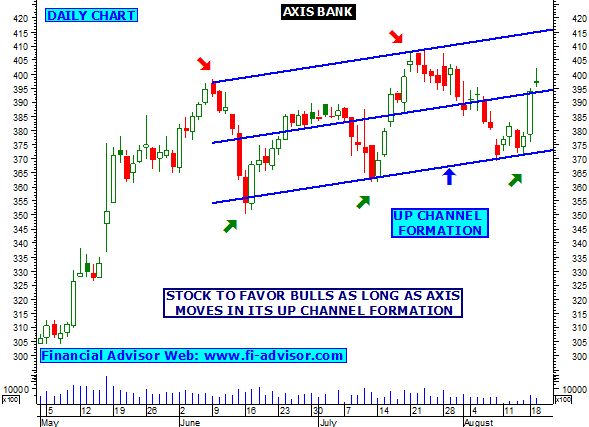
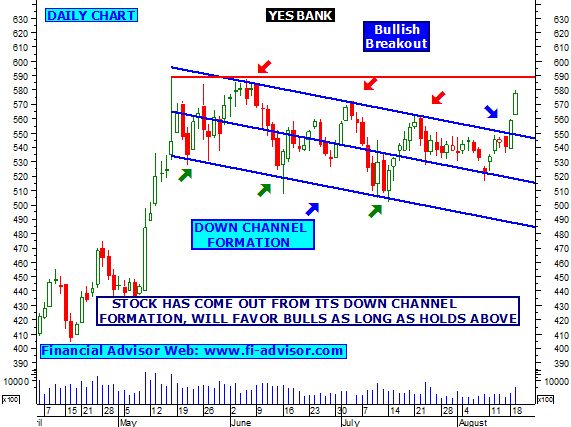
  • As pe graph no2 stock is moving in a up channel formation this indicates as long as stock moves in between up channel it will be favored by bulls, but if stock breaks it up channel on down side then sharp weakness is expecting in this stock.
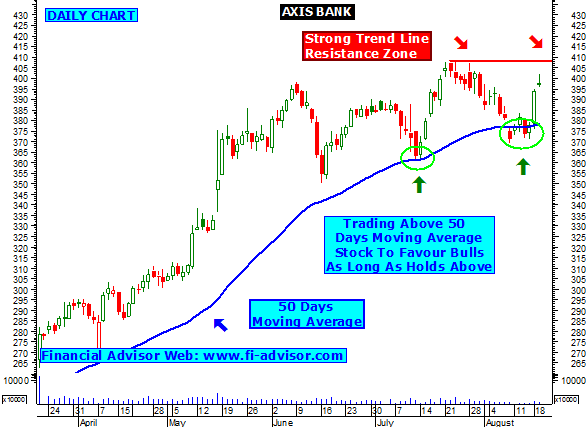
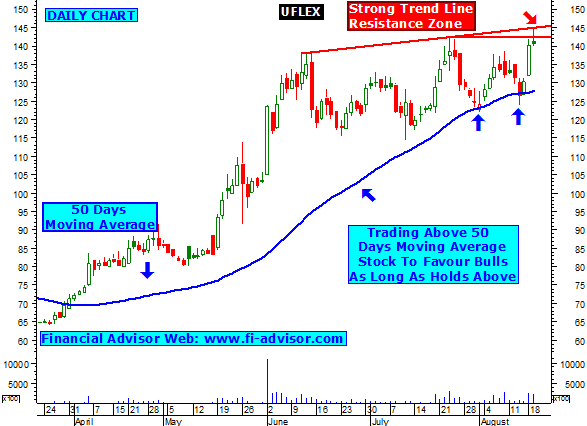
  • As per graph no3 stock is currently moving above its 50 and 100 days moving average this indicates the same trading above 50 DMA and 100 DMA will favor bulls. By looking closely technical indicates that stock is holding its 50 DMA from last 2 times stock took it 50 DMA support and bounced back and this time to JSW HOLDINGS is moving up from 50 DMA. Close Watch. 
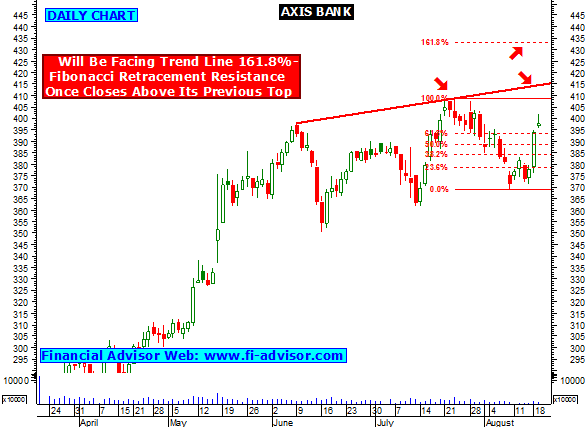
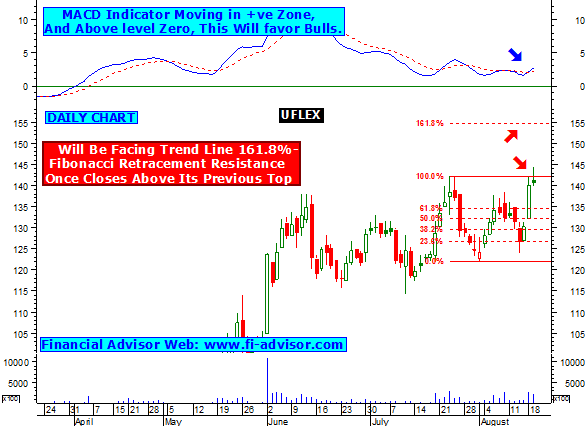
  • Now if stock moves up from current levels and closes and stays above 908 its previous top then chart indicates stock will find next strong resistance around 1000 its 161.8% fibonacci retracement.
    • Intraday close watch above 908, if stock holds above 908 during market hours then can see some intraday bulls action by JSW Holdings.
  • Click here to see all the free trading reports (tips) published by us on JSW HOLDINGS.
  • Tips on shares.

AXIS BANK Share Tips, Technical Analysis Chart, Intraday Stock Trading Graph Advice - Stock moving in a up channel formation, will favor bull, Further strength expecting once Axis closes above 409. (Updated On 21st August 2014, Thursday).


AXIS BANK


  • AXIS BANK currently moving in a up channel formation this indicates as long as stock moving in its channel formation it will be favored by bulls, but if stock breaks its up channel on down side and comes out then sharp weakness is expecting in AXIS BANK.
  • Technical also indicates that stock is moving up from 50 days moving average as shown in graph no2 , as long as stock holds above it will be favored by bulls once closes below stock will show first sign of weakness, Chart also indicates that on upper side stock will find strong trend line resistance around 409 its previous top, if stock closes and stays above 409 then bulls will get active for further up move for next few trading days.
  • If stock moves up from current levels and closes above 409 then on upper side will find resistance around 415 its trend line and next resistance around 433 its 161.8% fibonacci retracement as shown in graph no3. Close watch.
  • Click here to see all the free trading reports (tips) published by us on AXIS BANK.
  • Tips on shares.

SUN TV Share Tips, Technical Analysis Chart, Intraday Stock Trading Graph Advice - Stock has shown strong weakness after bearish breakout, Stock major indicator RSI has now entered in oversold, Sign of caution for bears. (Updated on 20th August 2014, Wednesday).


SUN TV


  • As per previous report published on SUN TV stock gave a sharp weakness after breaking its support @ 400 and made a low around 358 as mention in our previous report of SUN TV. (Click here to see previous report published on SUN TV).
  • Now as per graph 1 current chart, Technical indicates that stock gave a strong selling after breaking its up channel formation and stock is now facing its trend line support @ 358, this indicates as long as stock holds above 358 it will favor bulls but once stock closes and stays below 358 then bears will get active again and can see further weakness in SUN TV.
  • As per graph no2. stock major indicator "RSI" is now gone below 30 levels , this indicate SUN TV is now entered in oversold zone and its a sign of caution for bears and stock can bounce back. And as stock is now trading near support zone this indicates stock may get some pull back.
  • If stock moves up from current levels then will find strong fibonacci retracement resistance around 385, 400, 414 and 426 as shown in graph no 3.
  • Click here to see all the trading reports (tips) published by us on SUN TV (as per technical analysis point of view).
  • Tips on shares.

UFLEX Share Tips, Technical Analysis Chart, Intraday Stock Trading Graph Advice - Stock facing strong resistance at current levels, Strength expecting in UFLEX once stock closes above 145. (Updated On 20th August 2014, Wednesday).


UFLEX


  • UFLEX has formed bearish candle pattern in daily chart as shown in graph no1 , by looking at chart closely whenever stock gave bearish candle pattern we witnessed selling after that. Close watch as long as stock trades below 145 it will favor bears as per candle pattern once closes above 145 stock to favor bulls.
  • As per graph no2 stock is moving up from 50 days moving average support zone , as long as stock holds above it will be favored by bulls, chart also indicates stock is finding strong trend line resistance around 145 , once closes above 145 bulls will get active and we can see some bull rally in Uflex.
  • As per graph no3 stock major trend indicator "MACD" has now turned +ve and moving above level 0 this indicates stock can move up, If stock moves up from current level then on upper side will find next strong resistance around 154.50 its 161.8% fibonacci retracement. Close Watch.
  • Click here to see all the free trading reports (tips) published by us on UFLEX.
  • Free tips on share market.

MRF LTD Share Tips, Technical Analysis Chart, Intraday Stock Trading Graph Advice - Stock moving up form 50 days moving average , further strength expecting once stock closes above 24750. (Updated On 20th August 2014, Wednesday).


MRF LTD


  • As per previous report published on MRF LTD stock filed to close above its major trend line resistance @ 24750 and stock fell down and made a low around 23000. (Click here to see previous report published on MRF LTD).
  • Now daily chart indicates stock is again trying to test its previous trend line resistance around 24750, Once stock close and stays above 24750 then bulls to favor MRF for next few trading days.
  • As per graph no 2 if MRF moves up from current levels and closed and stays above 24750 then stock will find strong resistance around 26900 its 161.8% fibonacci retracement.
  • As per graph no 3, stock is moving up from 50 days moving average as long as stock holds above it will be favored by bulls but once it closes and stays below it will show first sign of weakness. Technical also indicates stock major trend indicator "MACD" is moving in +ve zone and above zero level this indicates stock can move up. Close watch.
  • Click here to see all the free trading reports (tips) published by us on MRF LTD.
  • Share tips for tomorrow.

YES BANK Share Tips, Technical Analysis Chart, Intraday Stock Trading Graph Advice - Stock has closed above its major resistance, will favor bulls, further strength expecting once Yes Bank closes above 588. (Updated on 20th August 2014, Wednesday).


YES BANK


  • As per previous report published on YES BANK stock gave a sharp move after breaking its resistance @ 563 and so far stock made a high of 580. (Click here to see past report published on YES BANK).
  • Now daily chart indicates that stock is moving up from its trend line support and around 23.6% fibonacci retracement support zone, as long as stock trades above it will be favored by bulls. And on upper side will find resistance around 588 its previous top. as per graph no1.
  • Technical also indicates that stock was earlier moving in a down channel formation , but now stock has come out from its down formation and we have witnessed sharp move after that , so as long as stock holds above it will be favored by bulls. as shown in graph no2 .
  • As per graph no3 stock has now closed above its resistance @ 563 and 572, and stock is now heading to test its next resistance @ 588 its previous top. So once stock closes above 588 and stays above the further strength is expecting in Yes Bank for next few days.
    • Intraday close watch once stock starts trading above 588, if holds above in day trading then intraday bulls action is expecting in Yes Bank.
  • Click here to see all the free trading reports (tips) published by us on YES BANK.
  • Stock tips for tomorrow.

HDIL Share Tips, Technical Analysis Chart, Intraday Stock Trading Graph Advice - Stock moving up from strong support zone, On upper side stock will find resistance around 101.50 and 105. (Updated On 20th August 2014, Wednesday).


HDIL


  • As per previous post published on HDIL stock gave shap weakness after breaking it support @ 86 and stock made a intraday low of 80. (Click here to see previous report published on HDIL).
  • Now daily chart indicates stock is moving up from strong golden ratio 61.8% fibonacci retracement and trend line support, this indicates as long as stock holds above it will be favored by bulls, but if stock closes and stays below 80 then sharp weakness is expecting. As shown in graph no1.
  • As per graph no2 technical indicates that stock is moving in a range bound zone as HDIL stuck between 105 and 85, once stock comes out from its range then sharp move is expecting. Chart also indicates that stock is finding minor trend line resistance around 101.50, bulls may get active once closes and stays above 101.50 and HDIL will find next resistance around 105.
  • As per graph no3 stock is moving up from 100 days moving average , as long as holds above it will favor bulls but once closes below 100 DMA it will be favor by bears and stock will show first sign of weakness. Even stock major trend indicator "MACD" is moving in +ve zone and above level zero, this indicates stock can move up from current levels. Close Watch.
  • Click here to see all the free trading reports (tips) published by us on HDIL.
  • Stock tips for tomorrow.

INDUSIND BANK Share Tips, Technical Analysis Chart, Intraday Stock Trading Graph Advice - Stock moving up from strong support, upper side will find resistance around 572, 587. (Updated on 20th August 2014, Wednesday).


INDUSIND BANK


  • As per previous report published on INDUSIND BANK stock failed to close above 585 and fell down after that made a low of 528. (Click here to see previous report published on INDUSIND BANK).
  • Now daily chart indicates stock is moving up from 50% fibonacci retracement support , so as long as stock trades above it will be favored by bulls. On upper side stock will find trend line resistance around 572, once stock closes and stays above 572 then stock looking bullish for next few days and stock will find next resistance around 587 its previous top.
  • As per graph no 2 stock is moving in a long range bound zone (587-520) once stock comes out from its range then sharp move is expecting.
  • As per graph no 3, once stock closes and stays above 587 (its previous top) then bulls will get active, and if stock moves up the Indusind Bank next resistance around 623 its 161.8% fibonacci retracement. Close Watch.
  • Click here to see all the free trading reports (tips) published by us on INDUSIND BANK.
  • Stock tips for tomorrow.

Advertisement

What is Intraday Tips ?

Q. What is Intraday Tips / Inraday Trading / Delivery trading.

A. There are basically two types of trading on stock market--
1- Delivery
2- Intraday

Delivery trading is one in which shares are bought and can only be sold after they are delivered by the broker.that means that they cannot be sold the same day , and delivery takes two to three days after they are bought and then they are ready to be sold.

Intraday trading which takes place for that very particular day and there is no delivery..they can be bought and sold the same day...and are automatically sold at the end of the trading session if you have not sold it by yourself during the trading session. The person who suggest such types of forecast is called

Intraday Tips

.