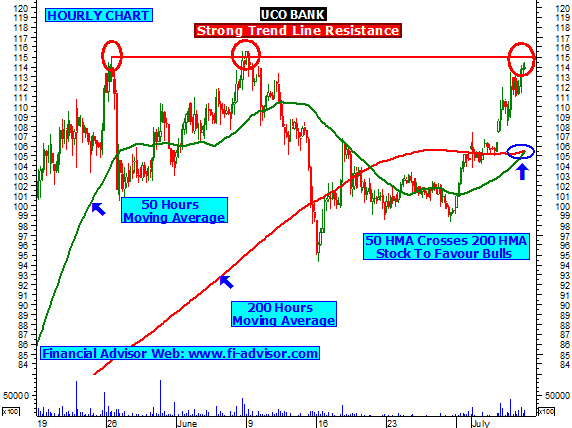
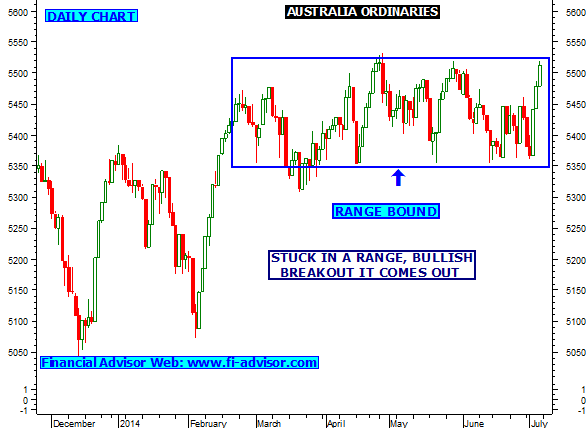
AUSTRALIAN ORDINARY INDEX
- AUSTRALIAN ORDINARY INDEX is trading in a strong range bond zone in daily chart, which indicates once index comes out from its range then sharp move is expecting, currently index is on the verge of breakout on upper side, if closes above then sharp up move is expecting for next 1-2 days. Current range 5535-5355.
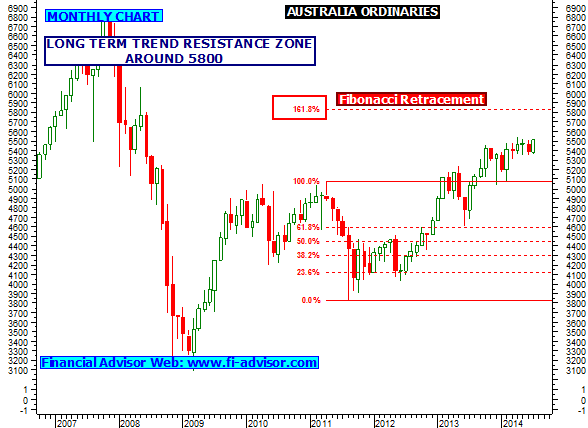
- Short term trend - Weekly chart indicates that index is moving up from strong trend line support zone and now heading for resistance, as shown above range is getting narrow, once break it and closes above or below trend line then short term trend will be sharp.
- Long Term Trend - Monthly chart indicates stock is on long term bullish mode and heading for 161.8% fibonacci retracement resistance. Close Watch.