Advertisement

Tips On Share - TECH MAHINDRA facing strong resistance around 2050. (Updated On 27th June 2014, Friday).


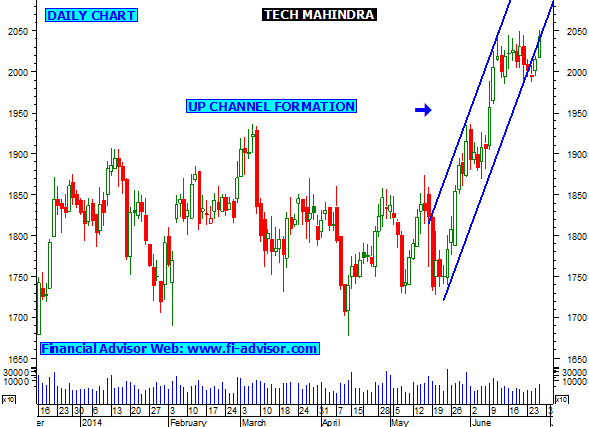
  • TECH MAHINDRA moving in an up channel in daily chart , chart indicates stock to favor bulls.
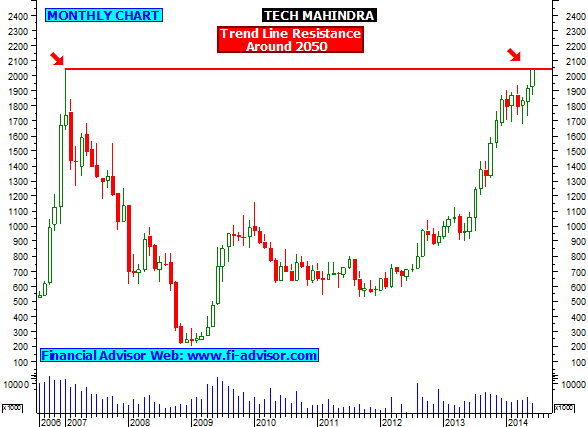
  • Technical chart also indicates that stock gave a strong bull rally once it broke its rectangle formation.
  • Close Watch stock is now facing strong trend line resistance around 2050 as shown above, stock to favor bulls in intraday once Tech Mahindra breaks 2050 with volumes and must stays above 2050.
Next Stock Will Update On 26th June 2014, Thursday Around 11:30 pm


Tips On World Indices - DOW JONES INDUSTRIAL AVERAGE (DJIA) (Technical Update on 24th July 2014 , Thursday).


  • DOW JONES is moving in a up channel formation in daily chart , dow is looking bullish, it must come out from it formation for some big action.
  • (Short term trend) - Weekly chart indicates that down is trading above 100 % fibonacci retracement and looks further bullish as long as hold above it 100% fibonacci retracement, upper side will face resistance around 17350 in weekly chart.
  • (Long term trend) -  Monthly chart indicates that dow is moving in long up channel formation sine year 2009, as expecting to move up further for next few months, upper side will face resistance around 19000 (161.8% fibonacci retracement) as shown above in monthly chart. Close Watch.


Free Tips On Share Market - ICICI BANK trading below major support. (Updated On 26th June 2014, Thursday).


  • ICICI BANK trading below 23.6% fibonacci retracement support in daily chart, chart indicates below 1398 can see some weakness in ICICI BANK.
  • Weekly chart indicates stock coming down from its major trend line resistance. Stock short term trend is not clear and indicates some further correction.
  • Monthly chart indicates that stock failed to closed above its major trend line resistance and witnessed selling from higher level and bulls looses interest in the close of month. Long term trend to looks bullish once stock closes above 1600.

Next Stock Updated at 26th June 2014, Thursday 5:15 pm

Tips On Share - TATA ELXSI (I) On the verge of breakout , has formed Triangle formation in daily chart. (Updated On 26th June 2014 , Thursday).


  • TATA ELXSI (I) has formed triangle formation in daily charts, which indicates that once stock breaks its triangle formation then can see sharp move for next few days, if breaks on up side then will favor bulls but if breaks on down side will favor bears. 
  • (Short term trend) - Weekly chart indicates that stock is moving up from 38.2 % fibonacci retracement and 20 weeks moving average, as long as holds above stock will favor bulls for short term trades.
  • (Long term trend) - Monthly chart indicates that stock is coming down from 261.8% fibonacci retracement and now correcting. No clear direction for long term trend of TATA ELXSI.
Next Stock Will Update On 26th June 2014 , Thurday Around 12:30 pm - CADILA HEALTH CARE


Tips On Share - SHIPPING CORPORATION OF INDIA (SCI) moving up from strong support, Bullish as long as holds above in daily chart. (Updated On 26th June 2014, Thursday).


  • SHIPPING CORPORATION OF INDIA (SCI) moving up from 38.2% fibonacci retracement and 20 days moving average as shown above, daily chart indicates as long as stock hold above stock will favor bulls and upper side will face resistance around 73.
  • (Short term trend) - Weekly chart of SCI indicates that stock moving up from strong trend line support as shown above stock to move further as long as it holds its support mention above in weekly chart, stock will favor short term bulls and on upper side will find resistance around 82.
  • (Long term trend) - Monthly chart indicates that stock is now trading around 23.6% fibonacci retracement and also heading for 50 months moving average if stock closes above and starts trading above resistance in monthly chart then long term trend looks bullish and will find next resistance around 95 & 115 (38.2% & 50% fibonacci retracement). Close Watch.
Next Stock Will Update On 26th June 2014, Thursday Around 11:00 am


Tips On Commodities - MCX COPPER 1 KG facing resistance (420, 423) in daily chart - (Updated On 30th June 2014, Monday).


  • MCX COPPER 1 KG facing strong trend line resistance around 420, 423, daily chart indicates that once Copper starts trading above its resistance levels and stays above then stock looks bullish and will favor bulls for next few days. Daily chart also indicates that stock facing 100 days moving average resistance, trading above 100 days moving average will favor bulls.
  • (Short term trend) - Weekly chart indicates that copper is moving in an up channel formation and now trading near support, charts indicates that as long as copper stays inside this up channel formation will favor bulls, If stock breaks its up channel formation and stays below then will favor bear and short term trend turns bearish.
  • (Long term trend) - Monthly chart indicates that stock facing strong trend line support and also 50 months moving average support zone as long as copper stays above long term trend of copper will favor bulls and bulls are on safer side.


Tips On Share - TITAN COMPANY facing strong resistance at current levels. (Updated On 26th June 2014, Thursday).


  • TITAN COMPANY is trading in a rage bound zone from last few days, charts indicates stock in a range between 247.50- 205, Stock will now try to come out from its range bound zone, Technical indicates once stock starts trading above 247.50 with volumes and stays above then will favor bulls for next few days.
  • (Short term trend) - Weekly chart indicates that TITAN moving in an up channel formation and now trading at resistance as shown above in chart, once stock breaks its formation and starts trading above for couple of weeks then will favor for short term traders to make position in TITAN.
  • (Long term trend) - Monthly chart of TITAN indicates that stock is trading above its 100% fibonacci retracement resistance and will favor bulls as long as it stays above, Upper side stock will face next fibonacci retracement resistance around 383 (161.8% fibonacci retracement). Close Watch.
  • Click here to see all the free trading reports (tips) published by us on TITAN.
  • Intraday Tips on stock market.


Advertisement

What is Intraday Tips ?

Q. What is Intraday Tips / Inraday Trading / Delivery trading.

A. There are basically two types of trading on stock market--
1- Delivery
2- Intraday

Delivery trading is one in which shares are bought and can only be sold after they are delivered by the broker.that means that they cannot be sold the same day , and delivery takes two to three days after they are bought and then they are ready to be sold.

Intraday trading which takes place for that very particular day and there is no delivery..they can be bought and sold the same day...and are automatically sold at the end of the trading session if you have not sold it by yourself during the trading session. The person who suggest such types of forecast is called

Intraday Tips

.